Mapping census data in R with tidycensus
- 2 minsIntroduction
The Census Bureau contains a rich source of demographic and economic data in the US.
Today I will be sharing a really cool package called tidycensus that allows users to interface with a select number of the US Census Bureau’s data APIs and return tidyverse-ready data frames. This package extends functionality further by allowing you to retrieve sf (simple feature) geometry alongside the data, which allows for a simplified workflow to produce maps.
Basic usage for tidycensus
Get a Census API key
Search for data. There are two main sources: the deccenial Census data and the American Community Survey data. Each specific dataset is identified by a variableID, and has a particular unit of geography. There are a wide range of geographies but some common ones include: the whole country, state, county, census tract, and census block group. You can read more detailed documentation here.
Retrieve data. There are two main functions you can use to retrieve data. get_acs() and get_decennial(). At minimum you must provide the geography and variable (dataset ID).
Make a map
library(sf)
library(tidyverse)
library(tidycensus)
library(viridis)
census_api_key(YOUR API KEY GOES HERE)
# Get data with geometry
# B19013_001 = MEDIAN HOUSEHOLD INCOME IN THE PAST 12 MONTHS
# (IN 2017 INFLATION-ADJUSTED DOLLARS)
ca_income <- get_acs(geography = "county",
variables = "B19013_001",
state = "CA",
geometry = TRUE)
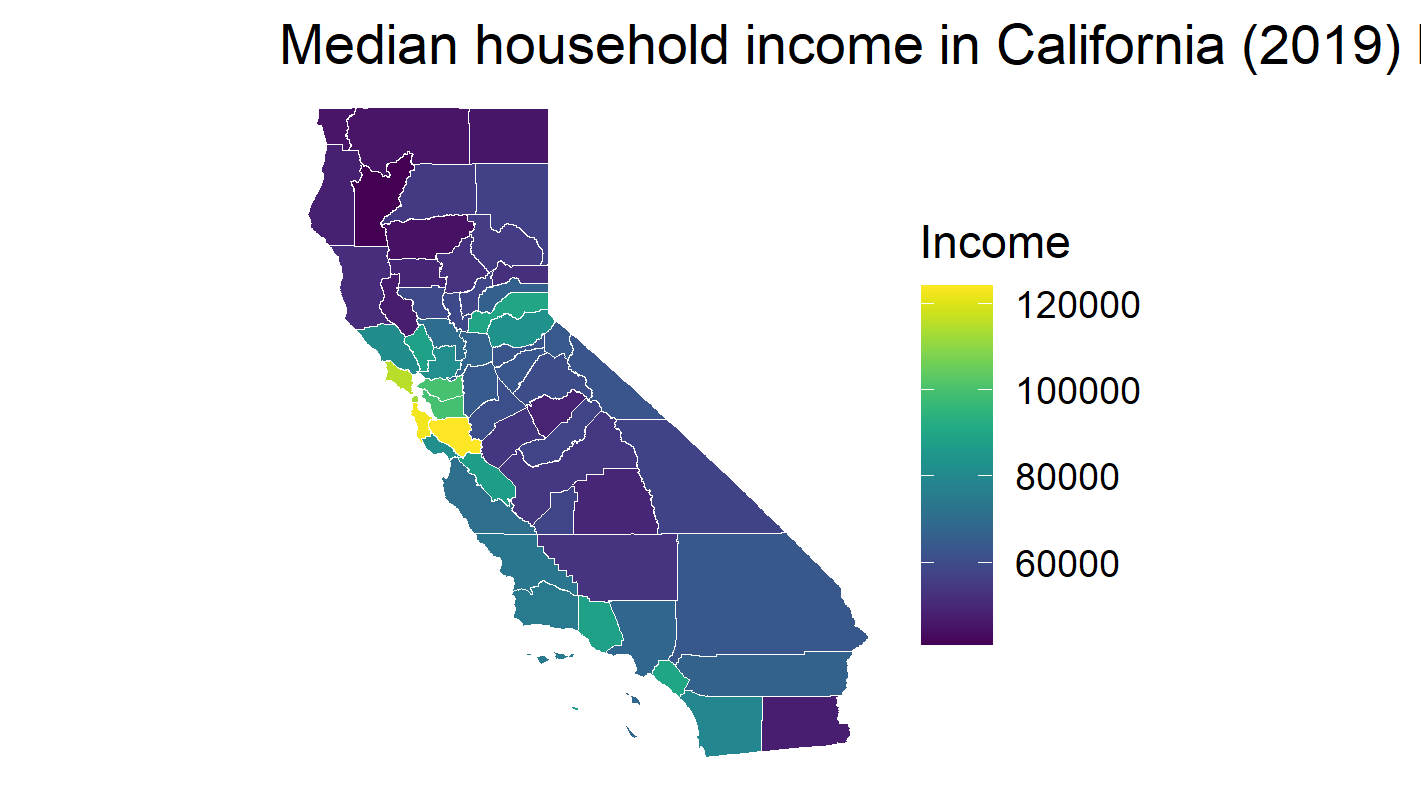
# Create map
ggplot() +
geom_sf(
data = ca_income,
mapping = aes(fill = estimate),
color = "white", size = 0.1,
show.legend = TRUE
) +
labs(
title = "Income in California",
fill = "Income"
) +
scale_fill_viridis() +
theme_void()
Related Posts

Tom Pham
COVID-19 Data Analyst